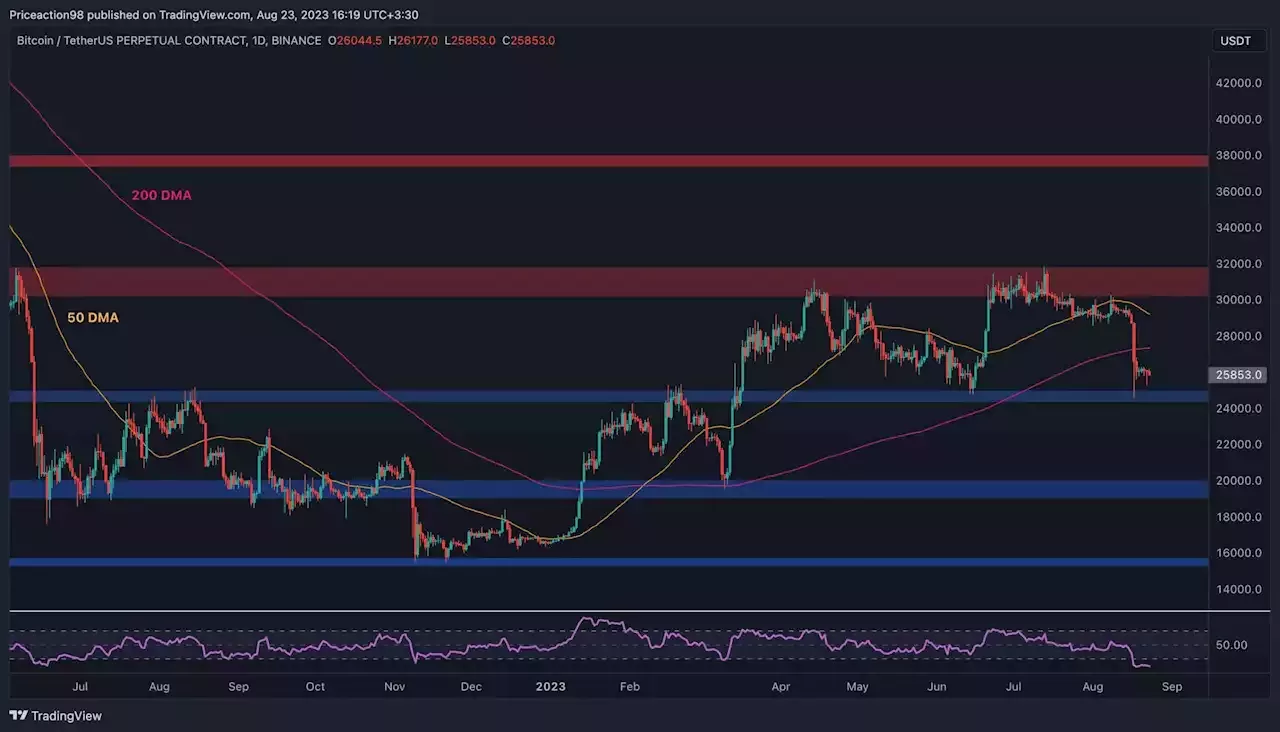
The following analysis looks at the details behind the crash and how it affects the overall market’s trend.On the daily timeframe, the price has been rejected from the $30K resistance level multiple times in recent months.
The last rejection from this level and the 50-day moving average near the same price have initiated a significant drop to the downside. BTC has broken below the critical 200-day moving average around the $28K mark. This is a vital trend indicator, and a drop below it points to a potential bearish shift.
Meanwhile, The $25K support currently holds the price, preventing it from dropping deeper. Still, with the overall market structure looking bearish, there is a considerable probability for a pullback to the 200-day moving average and a further continuation lower in the coming weeks.The recent decline looks more dramatic when analyzing the 4-hour chart.
The price has easily broken through the $27,500 support level and pierced through the $25K level with a long wick. Yet, the market is in the consolidation phase on this timeframe, as the $25K area has prevented the price from dropping lower successfully. The RSI indicator has recovered above the oversold region but is still below the 50% threshold. This means that while the price is currently ranging, the momentum is still bearish overall, and the market would likely attack the $25K zone again in the short term.
Portugal Últimas Notícias, Portugal Manchetes
Similar News:Você também pode ler notícias semelhantes a esta que coletamos de outras fontes de notícias.
 Crypto funds return to outflows amid market crash, bitcoin ETF sentimentCrypto investment products at asset managers such as Grayscale, Bitwise and ProShares returned to outflows of $55 million last week.
Consulte Mais informação »
